Investments
 Investments
Investments
Expand Financial (Expand) serves as a 3(38) investment fiduciary to oversee the plan’s investment menu giving you the expertise to maintain quality investments and meet ERISA standards. 3(38) Services Fact Sheet
Investment Policy
Expand provides a written Investment Policy Statement (IPS) to guide investment decisions.Quarterly Monitoring
Expand monitors the investment lineup each quarter to ensure investments are meeting standards defined in the IPS.Quarterly Reports
Expand provides you with quarterly plan investment reports that you and your advisor can review together.Fund Replacements
If an investment fails to meet the IPS standards, Expand replaces investments as needed.Core Investment Lineup
Participants can choose their own investment options and asset allocation from the following investments.
See important investment disclosures at the bottom of this page.
Managed Account Options
Passport401k offers five different managed account options to simplify and streamline participant investing. Employers and their Investment Advisors choose one of the following options.
DFA Target Date Funds
With Dimensional Fund Advisor’s (DFA) Target Date Funds, participants choose the fund corresponding to their age bracket. Dimensional manages the account, and over time, the investment emphasis shifts from income growth to income risk management.StoryLine by Stadion
StoryLine provides participants with a personalized investment experience considering variables unique to each participant. Stadion serves as a participant fiduciary and is required to act in the best interest of participants.Tandem ETF Portfolios
Keeping it Simple: Tandem ETF Portfolios consist of four risk-based asset allocation portfolios that invest mainly in ETFs. Each portfolio provides diversification across multiple asset classes consistent with an investor’s risk profile.Janus Henderson Global Allocation Funds
Janus Henderson Global Allocation Funds offer broad global diversification for investors through a strategic allocation across equities, fixed income and alternatives. Choose the option best suited to your risk tolerance.TIAA-CREF Lifecycle Funds
TIAA CREF Lifecycle Funds are designed to help investors maintain their standard of living in retirement, balance market, longevity and inflation risks and ensure age-appropriate asset allocation for all phases of life.Click one of the options below to see more details.
Dimensional Target Date Option
Participants seeking a professionally managed solution can choose a Dimensional Target date option which offers the following benefits.
Professional Money Management
Participants enjoy the benefits of having their account managed by a professional.Manage Risk Through Retirement
Managed to reduce interest rate, market, and inflation risks up to and through retirement.Retirement Income Planning
The investments are designed to help participants plan for and invest toward retirement income needs.Asset Allocation Over Time
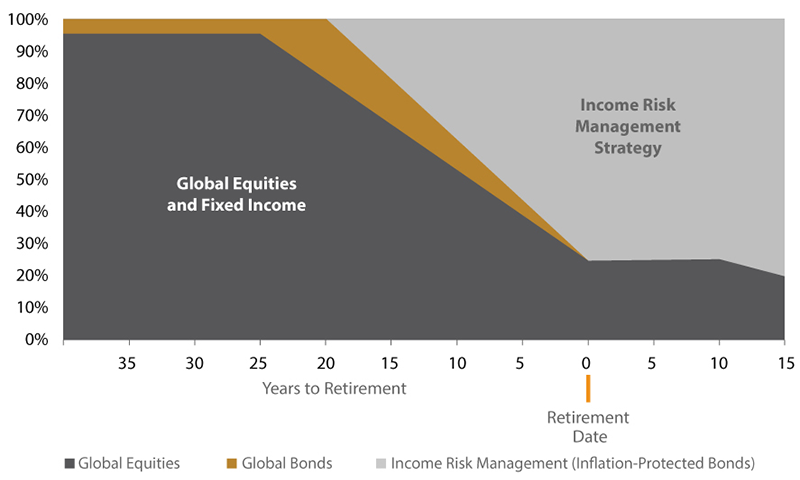
Over time, the investment emphasis shifts from income growth to income risk management.Target Date Fund Disclosures.
Investments in target date funds are subject to the risks of their underlying funds, and asset allocations are subject to change over time in accordance with each fund’s prospectus. An investment in or retirement income from a target date portfolio is not guaranteed at any time, including on or after the target date. An investment in a target date portfolio does not eliminate the need for investors to decide—before investing and periodically thereafter—whether the portfolio fits their financial situation. Target Date Funds are designed to target a year in which an investor may withdraw funds for retirement or other purposes. For more information, please refer to the prospectus.
There is no guarantee this investment strategy will be successful, and it is possible to lose money with this investment. Investments in stocks and bonds are subject to risk of economic, political, and issuer-specific events that cause the value of these securities to fluctuate. International investments are subject to additional risks such as currency fluctuation, political instability and adverse economic conditions. Fixed income securities are subject to increased loss of principal during periods of rising interest rates and may be subject to various other risks, including changes in credit quality, liquidity, prepayments, and other factors. Inflation-protected securities may react differently from other debt securities to changes in interest rates.
The funds are offered in five-year increments, with the target date indicating when an investor may expect to retire and stop making contributions to the fund.
Available Investments and Performance History
See important investment disclosures at the bottom of this page.
The target date funds are designed to be diversified1 across a mix of asset classes that include stocks and bonds. Over time, the investment emphasis shifts from income growth to income risk management.
Early Working Years
In a participant’s early years, contributions are primarily invested in income-growth assets (a diversified portfolio of global equities and fixed income) expected to increase in value over time.Later Working Years
Later in a participant’s career, increases in income-growth assets are invested toward inflation-protected securities.Nearing Retirement
As a participant nears retirement, the investment focus shifts from income growth to income risk management with more assets invested in inflation-protected securities to manage future retirement income risk.In Retirement
When participants retire and begin spending their savings, the portfolio remains focused on income risk management assets to guard against risks like inflation and market downturns.The glide path informs each fund’s asset mix based on the specified date and investment objective. The funds farther from their target date have more assets invested in stocks, while the funds closer to retirement emphasize inflation-protected bonds.

Dimensional has developed a retirement calculator that gives participants a sense of how much income their current savings may provide in retirement and enabling them to measure progress toward their goal.
StoryLine by Stadion
Stadion StoryLine is a professionally professionally managed account solution. It starts with an important premise: Every company – and every employee in that company – has a unique story. And those stories should inform their retirement plan. StoryLine is built with the funds from the underlying investments within the plan’s core lineup and portfolio allocations and glide paths are tailored at the company level and further refined at the participant level based on their age and risk tolerance questionnaire. View StoryLine Website
Professional Money Management
StoryLine provides a personalized investment experience considering variables unique to each participant, at no cost to the employer.Customized Risk Management
StoryLine attempts to make retirement investing easy – no need for participants to research investments, select funds, or make decisions. StoryLine seeks to manage participant emotions and improve outcomes.Hands-On Support
A Consultant from Stadion can provide on-site enrollment support, if requested. In addition, Stadion provides participants with live phone support to discuss investments.Plan-Level Customization
StoryLine goes beyond simple risk and age-based assessments. Plan-level customization takes into account a company’s unique workforce, and participants further tailor their account with Stadion’s proprietary risk tolerance questionnaire.The S&P 500 Index is the Standard & Poor’s Composite Index of 500 stocks and is a widely recognized, unmanaged index of common stock prices. It is not possible to invest directly in indexes (like the S&P 500) which are unmanaged and do not incur fees and charges. Investments are subject to risk and any of Stadion’s investment strategies may lose money. Past performance is no guarantee of future results.
StoryLine is a marketing term associated with investment advisory services and products provided by Stadion Money Management, LLC. Certain of the StoryLine accounts and funds utilize exchange-traded funds that bear the SPDR® trademark to implement Stadion’s investment strategy. Stadion receives both an annual payment and reimbursement for certain marketing and other assistance in connection with the StoryLine Accounts from State Street Global Advisors or its affiliates in connection with Stadion’s use of SPDR® ETFs in the StoryLine Accounts.
StoryLine is not managed, sponsored or endorsed by State Street Global Advisors or its affiliates and is not guaranteed by Stadion or its affiliates or by State Street Global Advisors or its affiliates. No party makes any representation or warranty, express or implied, regarding the advisability of investing in the StoryLine Accounts, including “StoryLine. Built with SPDR® ETFs.” State Street Global Advisors has no obligations to take into consideration the StoryLine Accounts or investors in the StoryLine Account when managing or creating SPDR® ETFs. Standard & Poor’s®, S&P®, S&P 500®, Standard & Poor’s 500, 500, Standard & Poor’s Depositary Receipts, and SPDRs® are trademarks of The McGraw-Hill Companies, Inc. and have been licensed for use by State Street Global Markets, LLC.
Standard & Poor’s®, S&P® and SPDR® are registered trademarks of Standard & Poor’s Financial Services LLC(S&P); Dow Jones is a registered trademark of Dow Jones Trademark Holdings LLC (Dow Jones); and these trademarks have been licensed for use by S&P Dow Jones Indices LLC (SPDJI) and sublicensed for certain purposes by State Street Corporation. State Street Corporation’s financial products are not sponsored, endorsed, sold or promoted by SPDJI, Dow Jones, S&P, their respective affiliates and third-party licensors and none of such parties make any representation regarding the advisability of investing in such product(s) nor do they have any liability in relation thereto, including for any errors, omissions, or interruptions of any index.
Custom Plan Level Qualified Default Investment Alternative (QDIA)
Determining a plan QDIA is an important fiduciary step. Stadion’s StoryLine offers customized plan level default glide paths designed to align with the participant population. Each plan sponsor has access to a document explaining how certain inputs may affect a plan default selection.
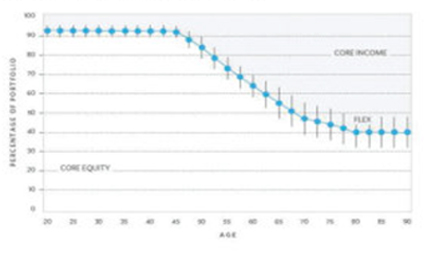
Plan Level QDIA Example
This chart shows how the mix of investments will be adjusted gradually over time to seek to reduce risk to help plan participants preserve what they’ve saved as they near retirement.
Founded in 1993, Stadion is an investment management firm that provides custom solutions to retirement plan advisors, plan sponsors and participants. We are proud of our ability to work with advisors by providing advisors with turnkey managed account services, target date fund solutions, and the opportunity to build custom managed accounts. Stadion believes that one-size-fits-all investment approach offered to most retirement plan participants does not account for the differences of each individual, which is why we work closely with advisors and recordkeepers to build custom retirement plan and participant level investment solutions.
Tandem ETF Portfolios
Participant’s seeking help from a professional money manager can choose one of Tandem’s four Exchange Traded Fund (ETF) Portfolios. These portfolios include the following benefits:

Simple
With Tandem, investing is simple for employees. They choose a single, professionally-managed portfolio based on answers to a risk questionnaire they take during enrollment, and the Tandem team does the rest.Balanced
Working within a proven investment discipline, each portfolio provides diversification across multiple asset classes consistent with an investor’s risk profile. They aim to provide sustainable returns without unnecessary risk.Transparent
Using Exchange Traded Funds to construct portfolios increases transparency over traditional mutual funds. With ETFs, investors and asset managers know exactly what they hold, making investment decisions more precise.Tandem Wealth Advisors
Tandem Wealth Advisors is a registered investment advisor. Information presented is for educational and informational purposes. Investments involve risk, such as the loss of principal, and are not guaranteed. Past performance does not guarantee future results. The investment return and principal value of any investment may fluctuate, and an investor’s shares may be worth more or less than the original cost at any given time or upon redemption. Before investing, investors should consider the investment objectives, expenses, and risks of a portfolio on their own or with the help of an investment professional
Tandem ETF™ Portfolios consist of four risk-managed strategies that seek to balance short and long-term risk and achieve returns that are stable, understandable, and sustainable.
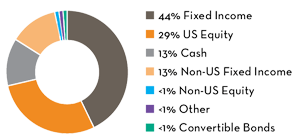
Tandem Conservative Portfolio™
The Tandem Conservative Portfolio seeks to protect principal by investing in lower-risk securities with less fluctuation such as fixed income and money market securities. A smaller portion of the portfolio is invested in equities to help offset inflation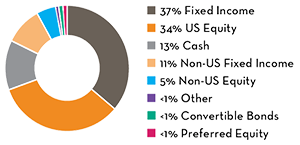
Tandem Moderative Conservative Portfolio™
The Moderate Conservative Portfolio seeks to protect a larger portion of the portfolios value, while taking on some risk with equity exposure for inflation protections. While still holding a portion of its assets in equities, a higher percentage in fixed income dampens short-term volatility, foregoing higher long-term returns for stability.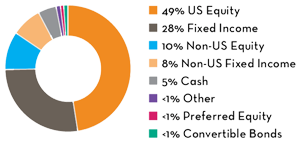
Tandem Moderate Portfolio™
The Tandem Moderate Portfolio balances risk and return to provide both capital appreciation and interest income for long-term gains. This balanced portfolio is likely to entail fluctuations in value over short-term periods, but with less volatility than the overall equity market over long-term periods.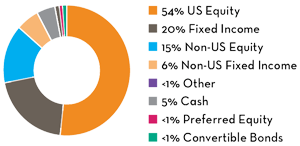
Tandem Moderate Aggressive Portfolio™
The Tandem Moderate Aggressive Portfolio favors investors with the capacity to ride out volatility and variations in return to obtain long-term growth of capital. This allocation involves more risk, but not as much as a portfolio invested only in equities.Tandem’s four continuously managed, risk-based portfolios help investor’s grow and shelter their retirement savings. The performance for each of these strategies is shown below.
Performance History
See important investment disclosures at the bottom of this page.
TIAA CREF Lifecycle Funds
Participants seeking help from a professional money manager can choose TIAA CREF Lifecycle Funds. These funds are designed to help investors:

- Maintain their standard of living over a prolonged retirement
- Carefully balance market, longevity and inflation risks
- Ensure age-appropriate asset allocation for all phases of life
Portfolio Design
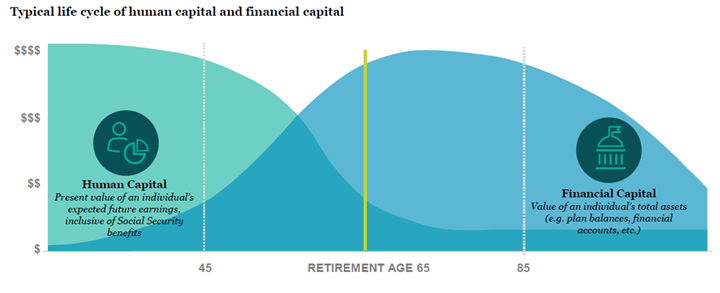
Human capital/financial capital framework dictates declining equity exposure over time.
As a person’s career progresses, the time available to earn income declines, resulting in a gradual reduction of human capital. In contrast, financial capital (an individual’s accumulated wealth in stocks, bonds and other investment assets) is generally lower for younger people and grows over time.
The funds are offered in five-year increments, with the target date indicating when an investor may expect to retire and stop making contributions to the fund. The following are TIAA CREF Lifecycle Funds.
Investment Name |
As of |
Birth Date Range – Low |
Birth Date Range – High |
Average Annual Total Return
|
Net Expense Ratio |
|||||||
TIAA-CREF Lifecycle 2010 Institutional (TCTIX) |
06/30/2021 |
N/A |
N/A |
16.64% |
8.93% |
8.47% |
7.15% |
0.37% |
||||
TIAA-CREF Lifecycle 2015 Institutional (TCNIX) |
06/30/2021 |
N/A |
N/A |
18.45% |
9.45% |
9.09% |
7.61% |
0.38% |
||||
TIAA-CREF Lifecycle 2020 Institutional (TCWIX) |
06/30/2021 |
N/A |
N/A |
20.37% |
9.93% |
9.84% |
8.17% |
0.39% |
||||
TIAA-CREF Lifecycle 2025 Institutional (TCYIX) |
06/30/2021 |
N/A |
N/A |
23.65% |
10.72% |
10.88% |
8.84% |
0.41% |
||||
TIAA-CREF Lifecycle 2030 Institutional (TCRIX) |
06/30/2021 |
N/A |
N/A |
27.06% |
11.53% |
11.91% |
9.48% |
0.42% |
||||
TIAA-CREF Lifecycle 2035 Institutional (TCIIX) |
06/30/2021 |
N/A |
N/A |
30.55% |
12.32% |
12.91% |
10.07% |
0.43% |
||||
TIAA-CREF Lifecycle 2040 Institutional (TCOIX) |
06/30/2021 |
N/A |
N/A |
34.22% |
13.07% |
13.91% |
10.63% |
0.44% |
||||
TIAA-CREF Lifecycle 2045 Institutional (TTFIX) |
06/30/2021 |
N/A |
N/A |
37.89% |
13.81% |
14.61% |
10.96% |
0.45% |
||||
TIAA-CREF Lifecycle 2050 Institutional (TFTIX) |
06/30/2021 |
N/A |
N/A |
38.62% |
13.99% |
14.79% |
11.05% |
0.45% |
||||
TIAA-CREF Lifecycle 2055 Institutional (TTRIX) |
06/30/2021 |
N/A |
N/A |
39.12% |
14.07% |
14.92% |
11.14% |
0.45% |
||||
TIAA-CREF Lifecycle 2060 Institutional (TLXNX) |
06/30/2021 |
N/A |
N/A |
39.70% |
14.19% |
15.06% |
N/A |
0.45% |
||||
TIAA-CREF Lifecycle 2065 Institutional (TSFTX) |
06/30/2021 |
N/A |
N/A |
N/A |
N/A |
N/A |
N/A |
0.45% |
||||
|
|
|
|
|
|
|
|
|
||||
Average Expense Ratio |
|
|
|
|
|
|
|
0.42% |
||||
Janus Henderson Global Allocation Funds
Janus Henderson Global Allocation Funds
As a leading global asset manager, Janus Henderson offers numerous investment options designed to help you reach your investment goals. After looking at our investment line-up, you may be feeling overwhelmed and not sure where to start. We aim to make investing with us an easy process for our clients. Janus Henderson Global Allocation Funds offer broad global diversification for investors through a strategic allocation across equities, fixed income and alternatives, with the goal of providing the opportunity for higher returns and lower volatility.
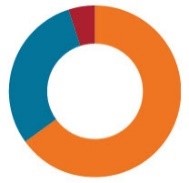
These funds of funds offer broad global diversification in a single investment by utilizing the full spectrum of Janus Henderson Investment expertise and solutions. The Funds are built to match your risk tolerance.
GLOBAL ALLOCATION FUND – CONSERVATIVE (JCAIX)

GLOBAL ALLOCATION FUND – MODERATE (JMOIX)
GLOBAL ALLOCATION FUND – GROWTH (JGCIX)
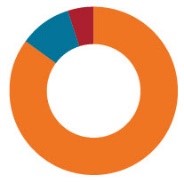
The following chart shows performance history of the Janus Henderson Global Allocation Funds.
Investment Name |
As of |
Birth Date Range – Low |
Birth Date Range – High |
Average Annual Total Return
|
Net Expense Ratio |
|||||||
Janus Henderson Balanced I (JBALX) |
06/30/2021 |
N/A |
N/A |
24.34% |
14.12% |
13.83% |
10.47% |
0.65% |
||||
Janus Henderson Global Allc Cnsrv I (JCAIX) |
06/30/2021 |
N/A |
N/A |
19.56% |
8.46% |
7.29% |
6.06% |
0.86% |
||||
Janus Henderson Global Allocation Gr I (JGCIX) |
06/30/2021 |
N/A |
N/A |
34.07% |
11.18% |
11.06% |
8.03% |
0.94% |
||||
Janus Henderson Global Allocation Mod (JMOIX) |
06/30/2021 |
N/A |
N/A |
26.70% |
9.79% |
9.16% |
7.02% |
0.89% |
||||
|
|
|
|
|
|
|
|
|
||||
Average Expense Ratio |
|
|
|
|
|
|
|
0.83% |
||||
Below are important disclosures about the investment information presented on this page.
Investment Chart Data Sources.
On the above chart, the columns for Investment Name, Morningstar Category, Inception Date, Expense Ratio and return information is provided by Morningstar, Inc. The columns specifying QDIA as well as the list of funds is provided by eFiduciary Advisor. ‘Principal Focused – Extended Duration’ investment option will have underlying fixed income investments with a longer average duration than a Cash Equivalent.
Stable Value and Fixed Income Disclosures.
Some Stable Value and Fixed Income Investment Options include restrictions at contract termination. Plan Sponsors should carefully review product contracts for applicable limits, rules and payout options.
© 2024 Morningstar, Inc. All Rights Reserved.
The information contained herein: (1) is proprietary to Morningstar and/or its content providers; (2) may not be copied or distributed; and (3) is not warranted to be accurate, complete or timely. Neither Morningstar nor its content providers are responsible for any damages or losses arising from any use of this information. Past performance is no guarantee of future results.

